Intercom’s new and improved reporting features
Today we are delighted to announce an exciting set of new capabilities, metrics, and improvements to the reporting features in Intercom. There are now dozens of new metrics, more customizable chart styles, and advanced tools for better root-cause analysis.
At this time of huge AI-driven change for the customer service industry, it’s more important than ever to have accurate insights into the performance of your customer support team and the quality of the service you provide.
According to our recent Customer Service Trends Report 2024, a quarter of support teams cannot say their current tools enable them to track the metrics that they need to, while 75% of support teams believe that traditional customer service metrics are changing as a result of recent developments in AI.
You spoke and we listened – now, you can get clear, actionable insights into the performance of your entire support organization in Intercom, whether for individual teammates, teams, or the organization as a whole. Alongside these new insights, we are unveiling powerful new chart types and chart drill-in features that allow users to get conversation-level insights from charts and reports.
New metrics, more insights
The right reporting metrics allow you to see the important signal in the noise of data. Discover just how these new features will give you the insights you need to drive increased efficiency.
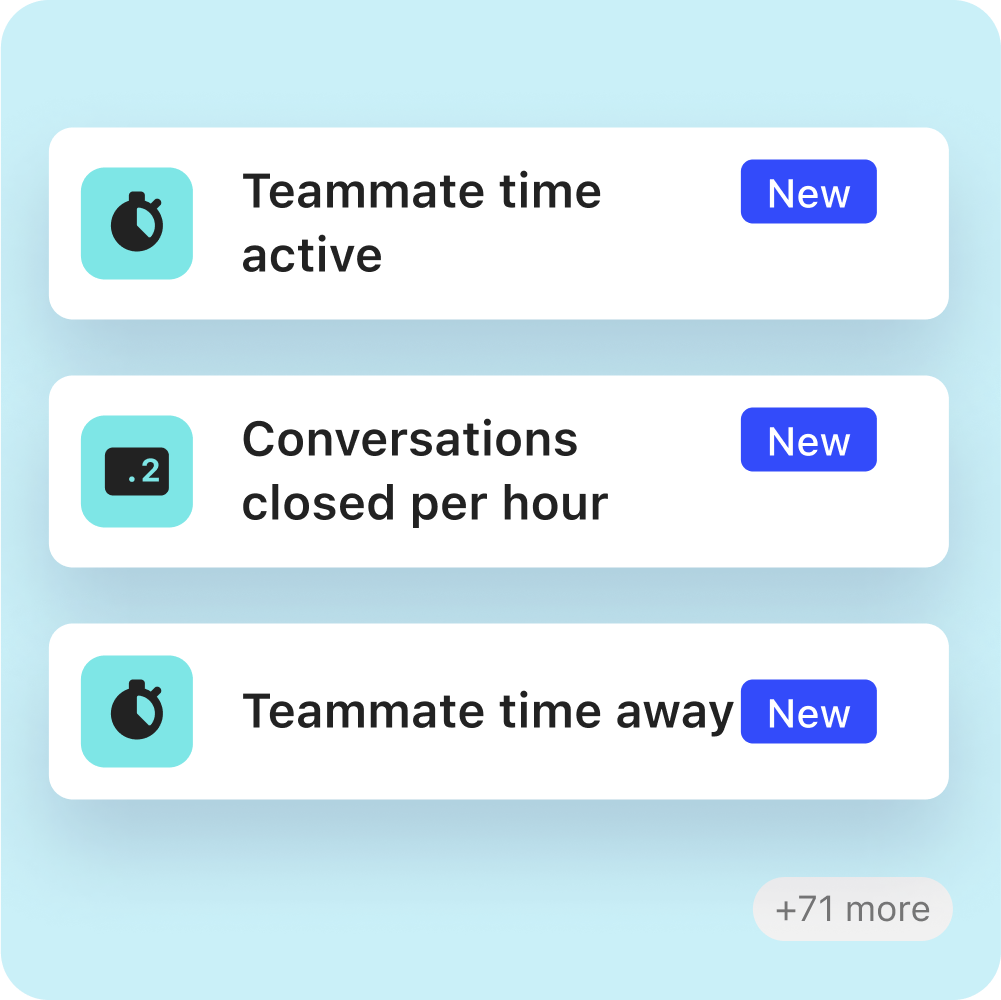
Teammate performance
There are now an array of new teammate performance metrics, unlocking new insights into how your team is functioning.
- Improved performance tracking: These metrics enable organizations to monitor and analyze their customer service team’s performance more effectively, identifying strengths and areas for improvement.
- Informed decision-making: The metrics provide valuable data to support decision-making regarding staffing, training, and overall customer service strategy, ultimately leading to a more efficient and higher-quality customer experience.
- Employee engagement and motivation: Tracking these metrics can help create a culture of continuous improvement and accountability.
Team inbox performance
Continuously improving the performance of your customer service team requires a precise overview of how the team is responding to customer queries.
- Measure the responsiveness of a specific team inbox: The new feature allows for the measurement of a team’s responsiveness by assessing the time it takes for the team to act on a conversation from the moment it lands in their inbox.
- Measure the workload of assigned conversations and the effectiveness of a particular team’s inbox: This new feature allows you to monitor the historical assignment of conversations to a team’s inbox and assess the number of conversations that they participate in and are closed from that specific inbox.
- Team benchmarking capability: The feature provides the ability to benchmark performance across different teams, enabling comparisons that can highlight top performers and areas for improvement.
New chart types and customization settings
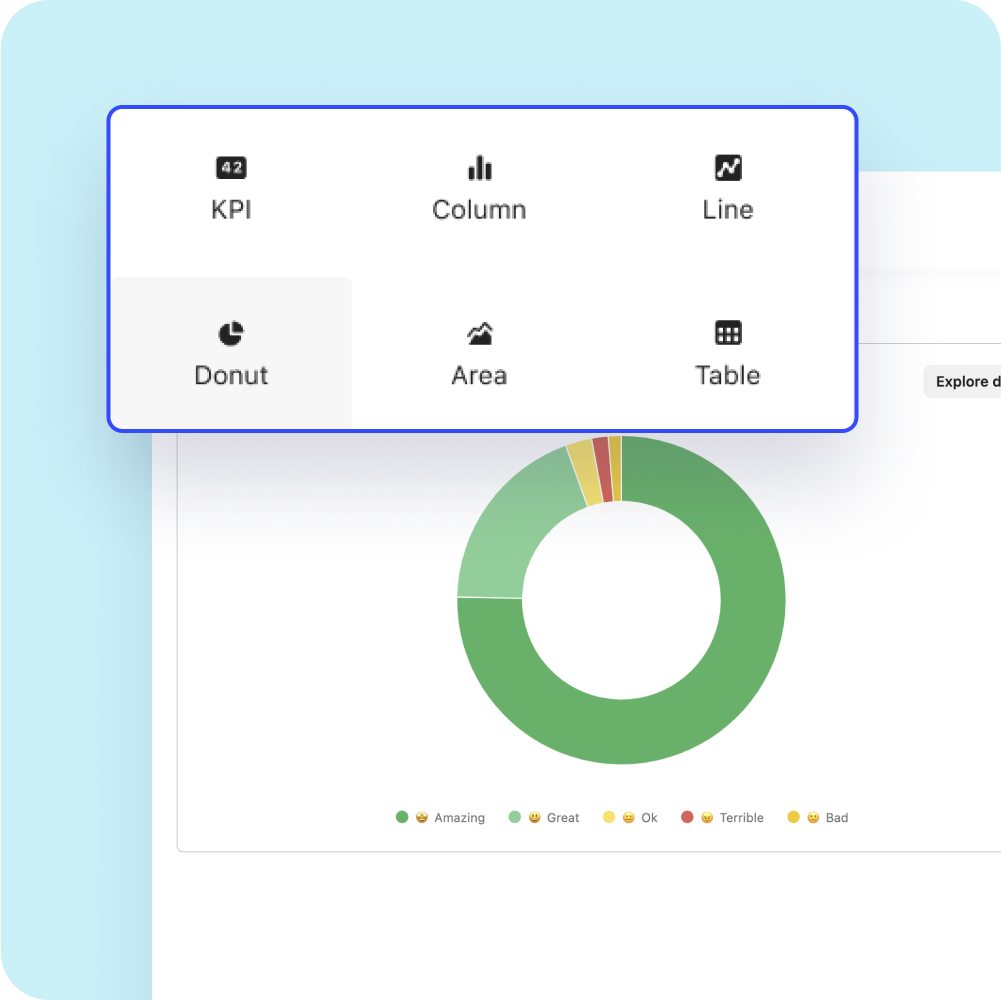
Your understanding of the underlying data is only as good as the representation of that data, which is why we’re releasing a variety of new chart types and greater control over them.
- Improved comparative analysis: The new features vastly enhance the ability to compare metrics over different time periods or against set benchmarks. This directly addresses the previous limitation by allowing for more dynamic and comprehensive comparative analysis within custom reports.
- Greater flexibility in data presentation: With the introduction of varied chart types like donut and area charts, customers now have a wider range of options for how they present and visualize their data, moving beyond basic line and bar charts.
- More customized data insights: The addition of custom “percentile” and “sum” aggregation methods allow for more nuanced data analysis. Users can dive deeper into their metrics, focusing on specific aspects that were not previously highlightable.
- Goal tracking and performance management: The “metric targets” feature provides a direct visual means to set and compare actual performance against desired goals or standards, which is crucial for effective performance management.
Chart drill-in
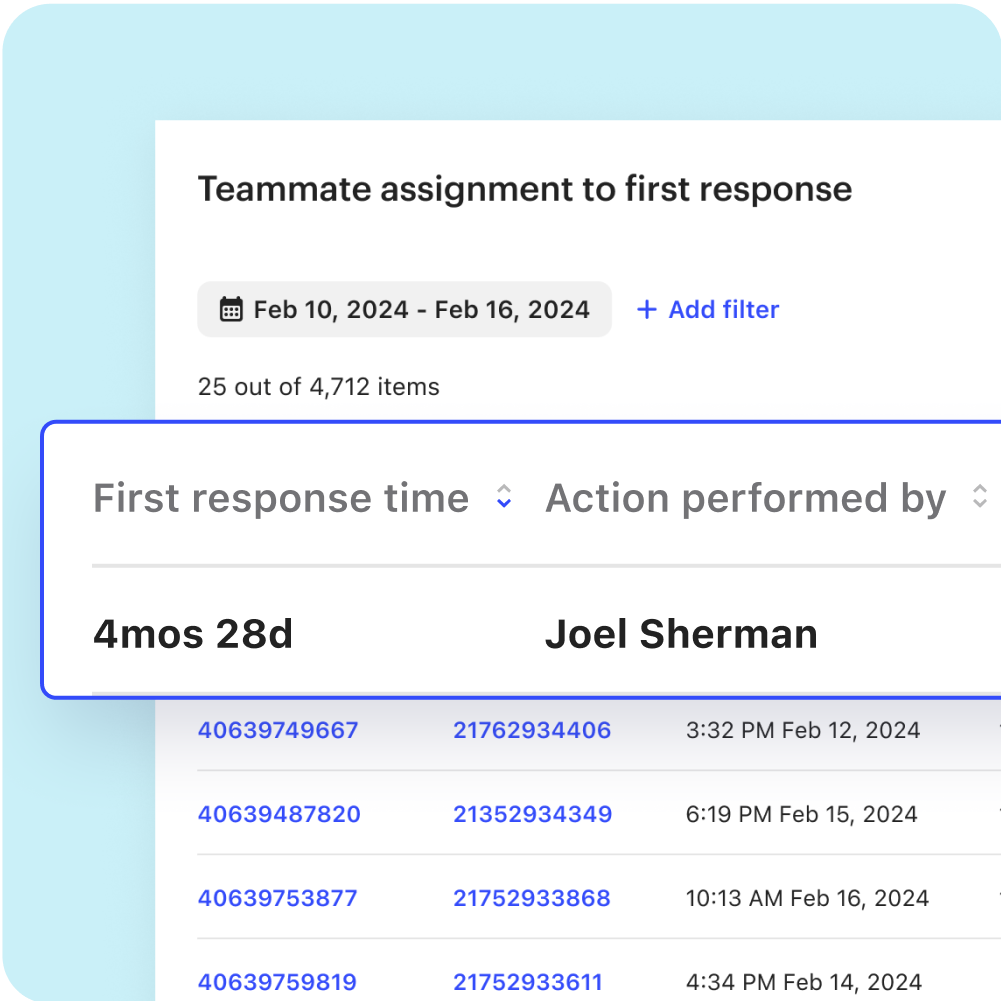
Reports can often feel opaque, making it difficult for managers to understand how the numbers are calculated, but our new “chart drill-in” feature enables users to click on data points in charts to see underlying data, details, and calculations.
It is now possible to zoom from a high-altitude overview of performance right down into the details of specific conversations – with this feature, you’re able to see the forest and the trees, the big picture and the important details.
- Enhanced data exploration & root cause analysis: Dive deeper into the data without leaving the Intercom app and rapidly identify underlying issues or trends, creating a more effective analysis process.
- More transparency of data: The drill-in feature offers a clearer view of the data sources and metrics used to create a chart, fostering trust and understanding of the information presented.
- Integrated insights: This feature makes the connection between the statistics and the underlying conversations in a way only an integrated platform can.
Intercom’s reporting keeps getting better
These reporting improvements tackle some of the biggest customer requests we’ve had over the last year and underscores our commitment to our customers and their feedback. Historically, a lot of CS analysis was done on different platforms, requiring data to be exported and insights surfaced in a variety of tools. These 74 new metrics, chart types, and improvements change that entirely – you can get the insights you need to provide great customer service, right in the platform you use to deliver great customer service.
Intercom’s reporting features will continue getting better as we lead the way in changing customer service forever through the industry’s leading AI-powered customer service platform.
Ready to embrace the future of customer service? Start a free trial today


